Metric checks and the Board
Error tracking answers what broke. Uptime monitors answer is it up. The question in between — is it about to break? — usually means a second tool, an agent on every host, and a dashboard product with its own login. For a small team that’s a lot of ceremony for “is the worker queue growing”.
So we built something smaller. Metric checks let an uptime monitor read a few gauge values out of the JSON your endpoint already returns, and the Board puts those next to your error data on one shared page.
Metric checks
Any monitor can capture metrics. Turn on Capture metrics and, on every check, booboo.dev parses the response body for this shape:
{
  "cpu_load":   {"value": 1.63, "limit": 4},
  "queue_depth": 8.56,
  "disk_used_gb": {"value": 31.5, "limit": 40}
}
A top-level object; each key is a caption, each value either a bare number or
{"value", "limit"}. That’s the whole format. Up to ten captions per monitor,
gauges only (a number that is true right now — not counters, not histograms),
sampled at your monitor’s interval: every minute on Team, every five on Starter.
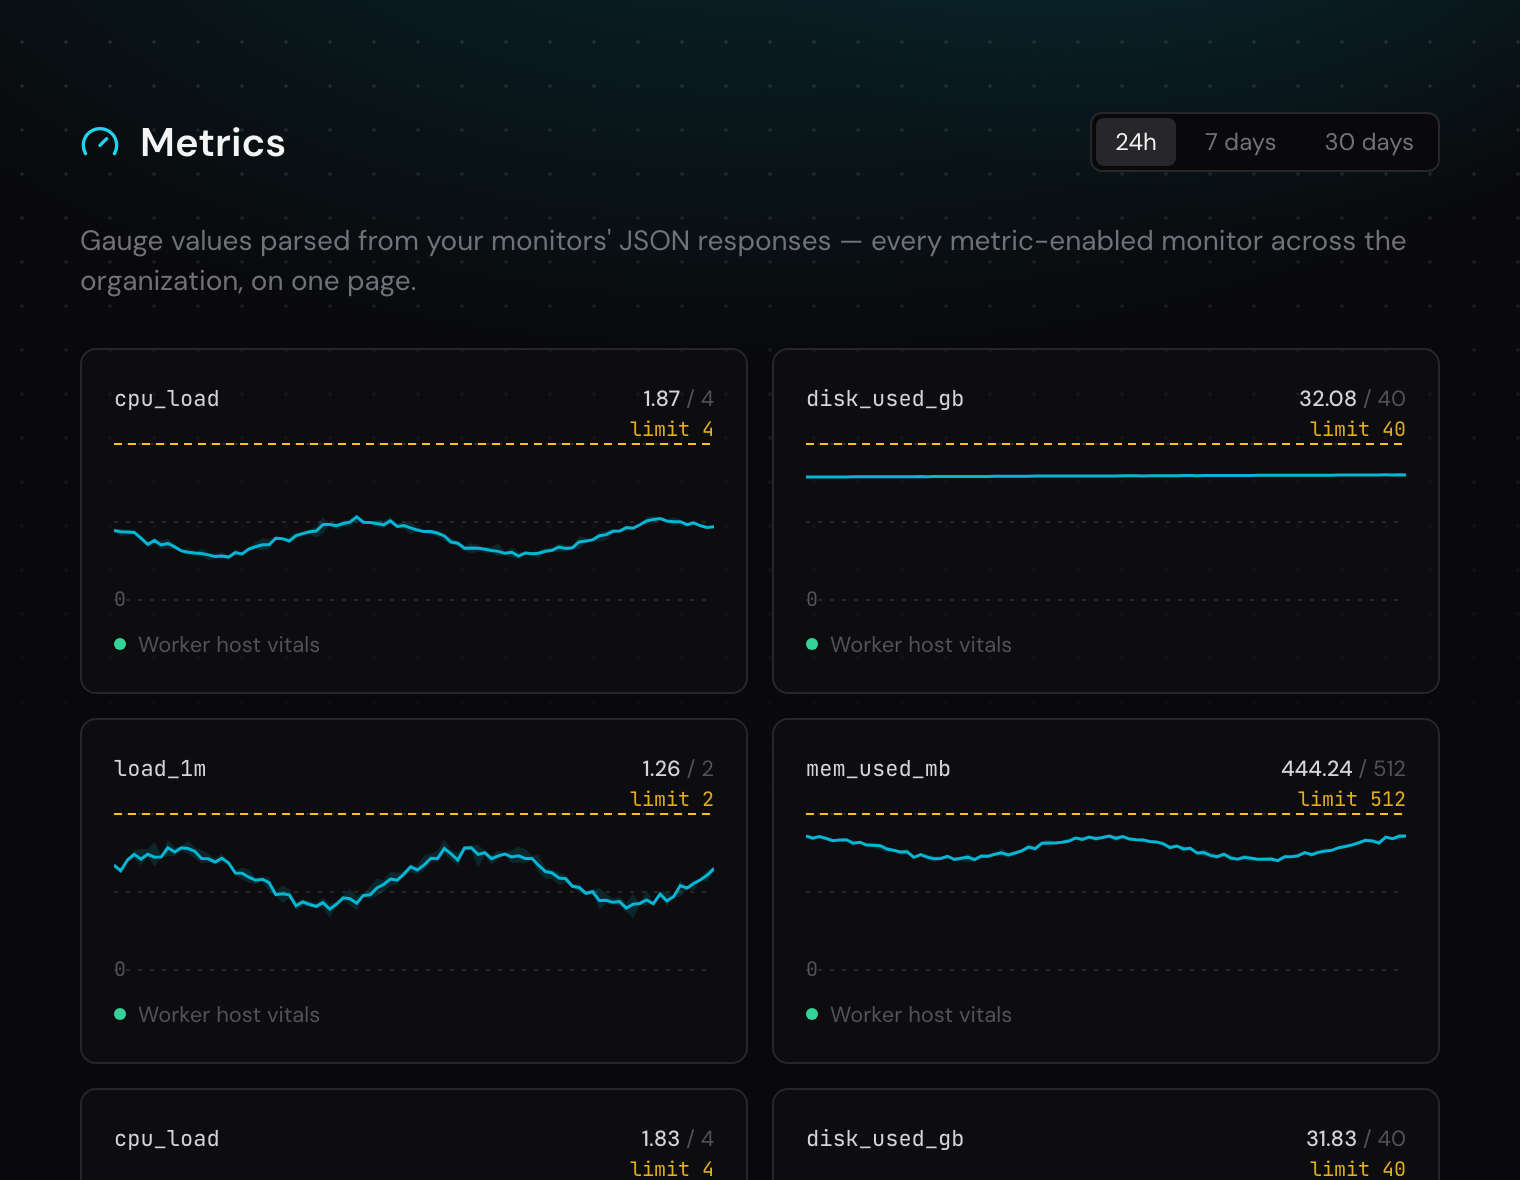
Each caption gets a chart with 24-hour, 7-day and 30-day ranges. If you send a
limit, it’s drawn as a line, so “31.5 of 40 GB” reads at a glance instead of
needing a mental lookup. The per-monitor page shows one monitor; the Metrics
page in the sidebar shows every metric-enabled monitor across the organisation.
What it isn’t: an agent, a time-series database, or a query language. There’s
nothing to install on the host. You write a handler that returns the numbers you
care about — os.getloadavg(), shutil.disk_usage(), a SELECT count(*) on
your jobs table — and the monitor you already run to check the endpoint is up
does the rest. A few patterns we’ve seen:
- Worker health: queue depth and oldest-job age from a tiny
/vitalsroute on the worker host. The queue-depth spike in the screenshot is exactly the thing you want to see before the timeouts arrive as errors. - Host vitals without Prometheus: load, memory, disk, with the machine’s real limits so the chart shows headroom.
- Business gauges: orders in the last hour, active sessions, items in a dead-letter queue. Anything you can count in one query.
We use it on booboo.dev itself: a monitor polls a small internal endpoint that reports our Celery queue depth, the fingerprinting backlog and events ingested in the last hour, and that is how we watch our own backend.
Security is the same as any monitor: if the endpoint needs a header, set it on
the monitor (an X-Api-Key is the usual pattern); keep the route off your public
surface or behind that key. Details and the exact parsing rules are in the
monitor docs.
The Board
Metrics are most useful next to the things they explain. The Board is a dashboard per organisation — one, shared, editable by every member — on a four-column grid of up to twenty tiles:
- Stat — a single number: events in the window, open issues, for all projects or one.
- Time series — event volume per day.
- Breakdown — events by environment or by release.
- Top issues — the issues with the most events right now, with their environment and last-seen.
- Monitor status — uptime, check count and response time for one monitor, with its own 24h / 7d / 30d switch.
- Metric — one caption from one metric-enabled monitor, with its limit.
Tiles resize and reorder; the window (14 or 30 days) applies to the whole board. Two templates get you going in one click: Errors overview (volume, open issues, breakdown, top issues) and Ops (a status and metric tile for each of your monitors). Delete a monitor or project a tile points at and the tile shows as stale rather than breaking the board.
The Board is where the two halves of booboo.dev meet: the error spike on the left and the queue depth that caused it on the right, on a page you can leave open on the office screen.
Availability
Metric checks and the Board are included on Starter (€18/month) and Team (€59/month). Uptime monitors themselves are on every plan, including Free (one monitor, 30-minute interval). Limits per plan are on the pricing page; the docs cover monitors and the Board.
If you’ve got a gauge you’d like to chart that doesn’t fit the shape above, tell us — the format is deliberately tiny, and we’d rather extend it for a real case than guess.